Quick Answer
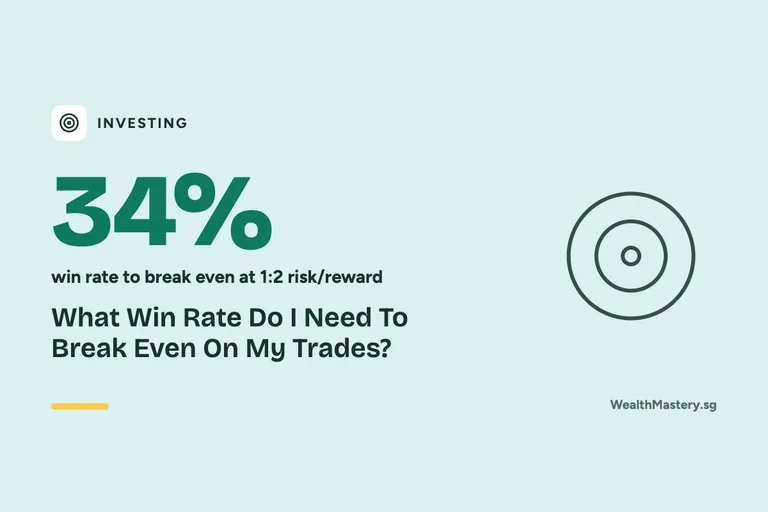
Break-even win rate equals your net average loss divided by your net average win plus net average loss. At 1:2 risk/reward with S$2 of costs a trade, you need to win 34% of trades to break even. At a 45% win rate, that averages about S$3,300 per 100 trades.
The Useful Number: At 1:2 risk/reward with S$2 of costs a trade, you need to win 34% of trades to break even. At a 45% win rate that averages about S$3,300 per 100 trades.
How Do Win Rate And Risk/Reward Fit Together?
Your win rate is the share of trades that make money. Risk/reward compares your average loss with your average win: 1:2 means you lose S$1 on a typical loser for every S$2 on a typical winner. The bigger your average win compared with your average loss, the lower the win rate you need.
Break-even win rate = net loss ÷ (net win + net loss), where costs come off every win and add to every loss.
What Does 1:2 Risk/Reward Need?
- Average win, after S$2 of costs: S$198
- Average loss, plus S$2 of costs: S$102
- Break-even win rate: 34%
- Expectancy at a 45% win rate: About S$33 per trade
- Per 100 trades: About S$3,300
At 1:1 with the same costs, you need to win 51% of trades, and a 45% win rate loses about S$1,200 per 100 trades. Costs matter most when wins and losses are small.
- Average Win After Costs: S$198
- Average Loss Plus Costs: S$102
- Break-Even Win Rate: 34%
- At A 45% Win Rate, Per 100 Trades: About S$3,300
Data as of . Source: MoneySense — Investment Risk.
What Can The Averages Hide?
Averages from past trades may not continue. Even with a positive expectancy, a run of losses can be long and deep, and position sizes change the result. The calculator ignores tax, slippage and how your trades are sized. It is arithmetic, not a trading strategy, and it does not suggest trades.
What Can You Check Next?
Find your real costs per trade with the trade cost calculator and see how big falls are to recover from in the loss recovery guide. Trading involves risk of loss.
Quick Check
Three statements from this guide. Tap True or False to check what you have read. Nothing is saved.
Card 1 Of 3
At 1:2 risk/reward with S$2 of costs a trade, you need to win 34% of trades to break even.
Card 2 Of 3
A positive expectancy means every month will make money.
Card 3 Of 3
Costs matter most when average wins and losses are large.
Your Score
Try It With Your Numbers
Open the calculator with this guide’s example filled in. Then change the numbers to match your situation.
Open Break-Even Win Rate And Expectancy Calculator →Frequently Asked Questions
What Is Trading Expectancy?
It is the average amount a trade makes or loses over many trades, worked out from your win rate, average win and average loss after costs.
What Win Rate Does 1:1 Risk/Reward Need?
With S$2 of costs a trade and equal average wins and losses, you need to win 51% of trades.
A 45% win rate loses about S$1,200 per 100 trades.
Does A Positive Expectancy Mean I Will Make Money?
No.
Past averages may not continue, and losing streaks happen even with a positive expectancy. The calculator is arithmetic, not a strategy.
Try Break-Even Win Rate And Expectancy Calculator →Save Guides Free
Keep This Guide For Your Next Money Decision.
Build your own reading list and pick up where you left off with a free WealthMastery account.
Free account · Tools stay free without an account.
Sources & Assumptions
Sources checked 12 October 2026. These are examples only. Check the stated assumptions and limits before you use a result.
General information and estimates, not advice. Simple arithmetic on the averages you enter. Past results do not predict future trades. Checked 4 October 2026.