Quick Answer
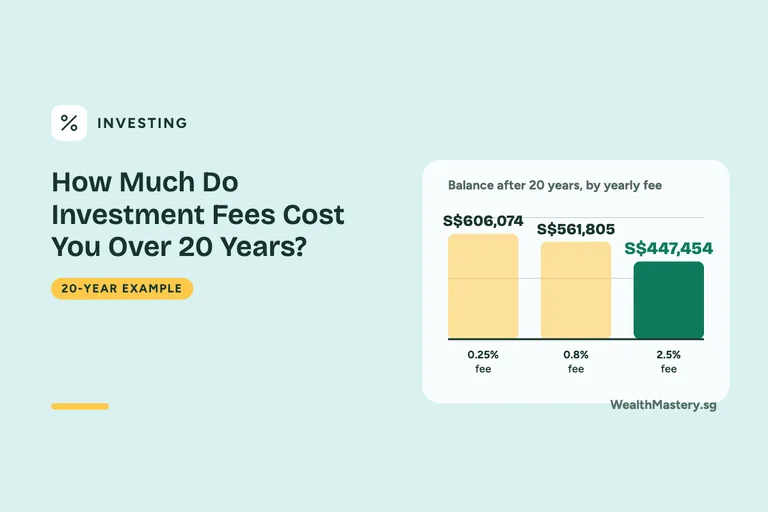
In this 20-year example, the gap in ending balance between 0.25% and 2.5% yearly fees is about S$158,620. You start with S$50,000, add S$1,000 a month and assume a smooth 6% gross return. Balances end at S$606,074 and S$447,454. The gap includes lost growth, not just fees paid.
The Useful Number: In this 20-year example, the ending-balance difference between 0.25% and 2.5% annual fees is about S$158,620.
How Do You Compare Fees Fairly?
A fee comparison is easiest to read when only the fee changes. The calculator keeps the starting amount, monthly contributions, gross return and time the same across three options.
The labels are examples, not live quotes or endorsements. Enter each product’s yearly costs from its documents, and check whether fund, platform and adviser fees are already included so you do not count a cost twice.
What Do Three Fee Levels Cost Over Twenty Years?
Start with S$50,000, add S$1,000 a month and assume a smooth 6% yearly gross return for 20 years: S$290,000 put in. A 0.25% yearly fee ends at S$606,074, a 0.8% fee at S$561,805 and a 2.5% fee at S$447,454.
The S$158,620 gap includes the growth the fees could have earned, not just the fees paid.
- Total Money Put In: S$290,000
- At A 0.25% Yearly Fee: S$606,074
- At A 2.5% Yearly Fee: S$447,454
- Gap: Fees Plus Their Lost Growth: S$158,620
Data as of . Source: MoneySense — Understanding Unit Trusts.
Try Your Numbers
What Would Your Fee Cost You?
Compares your higher fee with a 0.25% fee, at a 6% gross return, as in the example.
Gap In Ending Balance
S$158,620
- Total Money Put In
- S$290,000
Rough estimate. See the full tool for assumptions.
What Does The Fee Percentage Leave Out?
The calculator takes each yearly fee off the gross return and compounds the rest monthly. It leaves out billing dates, fee tiers, sales charges, performance fees, trading spreads and surrender charges; check those in the fee schedule. MoneySense’s unit-trust guide lists one-time and ongoing fees to review.
How Do You Weigh Cost Against Risk And Features?
Here a lower fee keeps more money because the return is the same. Real products differ in assets, risk, services and access rules, so a fee comparison alone cannot tell you which fits your needs.
Make the costs comparable, then try a range of returns in the Compound Growth Calculator before you commit.
Quick Check
Three statements from this guide. Tap True or False to check what you have read. Nothing is saved.
Card 1 Of 3
The S$158,620 gap is just the total fees paid to the provider.
Why?
In the model, money taken as fees stops compounding. So the gap between the 0.25% and 2.5% fees is bigger than the fees paid alone.
Card 2 Of 3
The calculator keeps the money put in, gross return and time the same for all three fees.
Why?
In the example, the 6% gross return and 20 years are the same for every option. The labels are examples, not live quotes.
Card 3 Of 3
A lower fee always means a better product.
Why?
In this same-return example a lower fee keeps more money, but a fee comparison alone cannot tell you which product fits your needs.
Your Score
Try It With Your Numbers
Open the calculator with this guide’s example filled in. Then change the numbers to match your situation.
Open Investment Fees Impact Calculator →Frequently Asked Questions
Why Is The Balance Difference Bigger Than The Fees I Paid?
The difference includes the growth that the money taken as fees could have earned in the model.
It is not just the total fees paid to the provider. In the example, a 0.8% fee ends at S$561,805, between the 0.25% and 2.5% results.
Which Costs Should I Include In The Annual Fee?
Enter the yearly costs from each product’s documents.
Check whether fund expenses, platform charges and adviser fees are already included, so you do not count the same cost twice. The calculator does not copy billing dates, fee tiers, sales charges, performance fees, trading spreads or surrender charges.
Try Investment Fees Impact Calculator →Does A Lower Fee Mean A Better Product?
Not on its own.
In this same-return example, a lower fee keeps more money. But real products may differ in assets, risk, services and access rules. A fee comparison alone cannot tell you which product fits your needs.
How Does The Calculator Apply Fees?
It takes each yearly fee off the gross return and compounds the rate left over each month.
The starting amount, monthly amount, gross return and time period stay the same across the three options. All figures are rounded.
Get The Checklist (Free For Members)
Before You Start Investing Checklist. The checks to make before your first trade, from safety cushion to costs, scams and a yearly review.
Get The ChecklistFree account. No password needed.
Save Guides Free
Keep This Guide For Your Next Money Decision.
Build your own reading list and pick up where you left off with a free WealthMastery account.
Free account · Tools stay free without an account.
Sources & Assumptions
Sources checked 11 September 2026. These are examples only. Check the stated assumptions and limits before you use a result.
Illustration of how yearly fees reduce an ending balance, using identical cash flows and gross returns. It does not compare actual products, performance or the value of advice. All figures are rounded.